Redox Flow Battery
LIVE Stream
Battery Status
Connecting…
—
Last update: —
SOC: 0%
ANOLYTE
CATHOLYTE
0°C
STACK
0
kW
Simulation
0°C
←
←
←
→
PUMP
PUMP
Basic Metrics
Cycles Cumulative
0
Active Power AC
0 kW
Discharged Energy (Last cycle)
0 kWh
Outside air temperature
0°C
Battery Degradation
0.00%
Monthly:
0.00%
Disclaimer:
• Maximal DC power of battery is 72 kW
• Maximal stored energy for both modules is 80 kWh
• Typical cycle SOC range is 15% to 85%
• Cycles cumulative represent total number of cycles of both modules from 27.6.2025
• SOC represents average SOC level of both modules
• Active power AC represents total power of both modules
• Discharged energy represents DC energy discharged from Module 2 during one standard cycle
• Electrolyte temperature represents average value from both tanks for anolyte and catholyte
• Battery degradation is calculated from initial value of Module 2 after every 50–70 cycles of operation
The information published on this website, information about products, services and activities of INO-HUB Energy j.s.a. (including technical data and parameters of battery prototypes) is for informational purposes only and is not legally binding; INO-HUB Energy j.s.a. does not warrant its accuracy, completeness, reliability, applicability or timeliness, does not assume any warranty (including warranties of merchantability, non-infringement and suitability for a particular purpose), no obligation or liability with respect thereto, and shall not be liable for any damages or other loss resulting from the use of this information by any third party. The information may be changed or updated without notice.
Power and Temperature – History – 24 hours
Battery Degradation Comparison
Current Battery Status
0
cycles
Progress:
0.000%
Capacity:
100.00%
Expected Life:
20,000 cycles
Compare the degradation rates of Redox Flow Battery vs LFP (LiFePO4) Battery under the same load conditions:
System Images
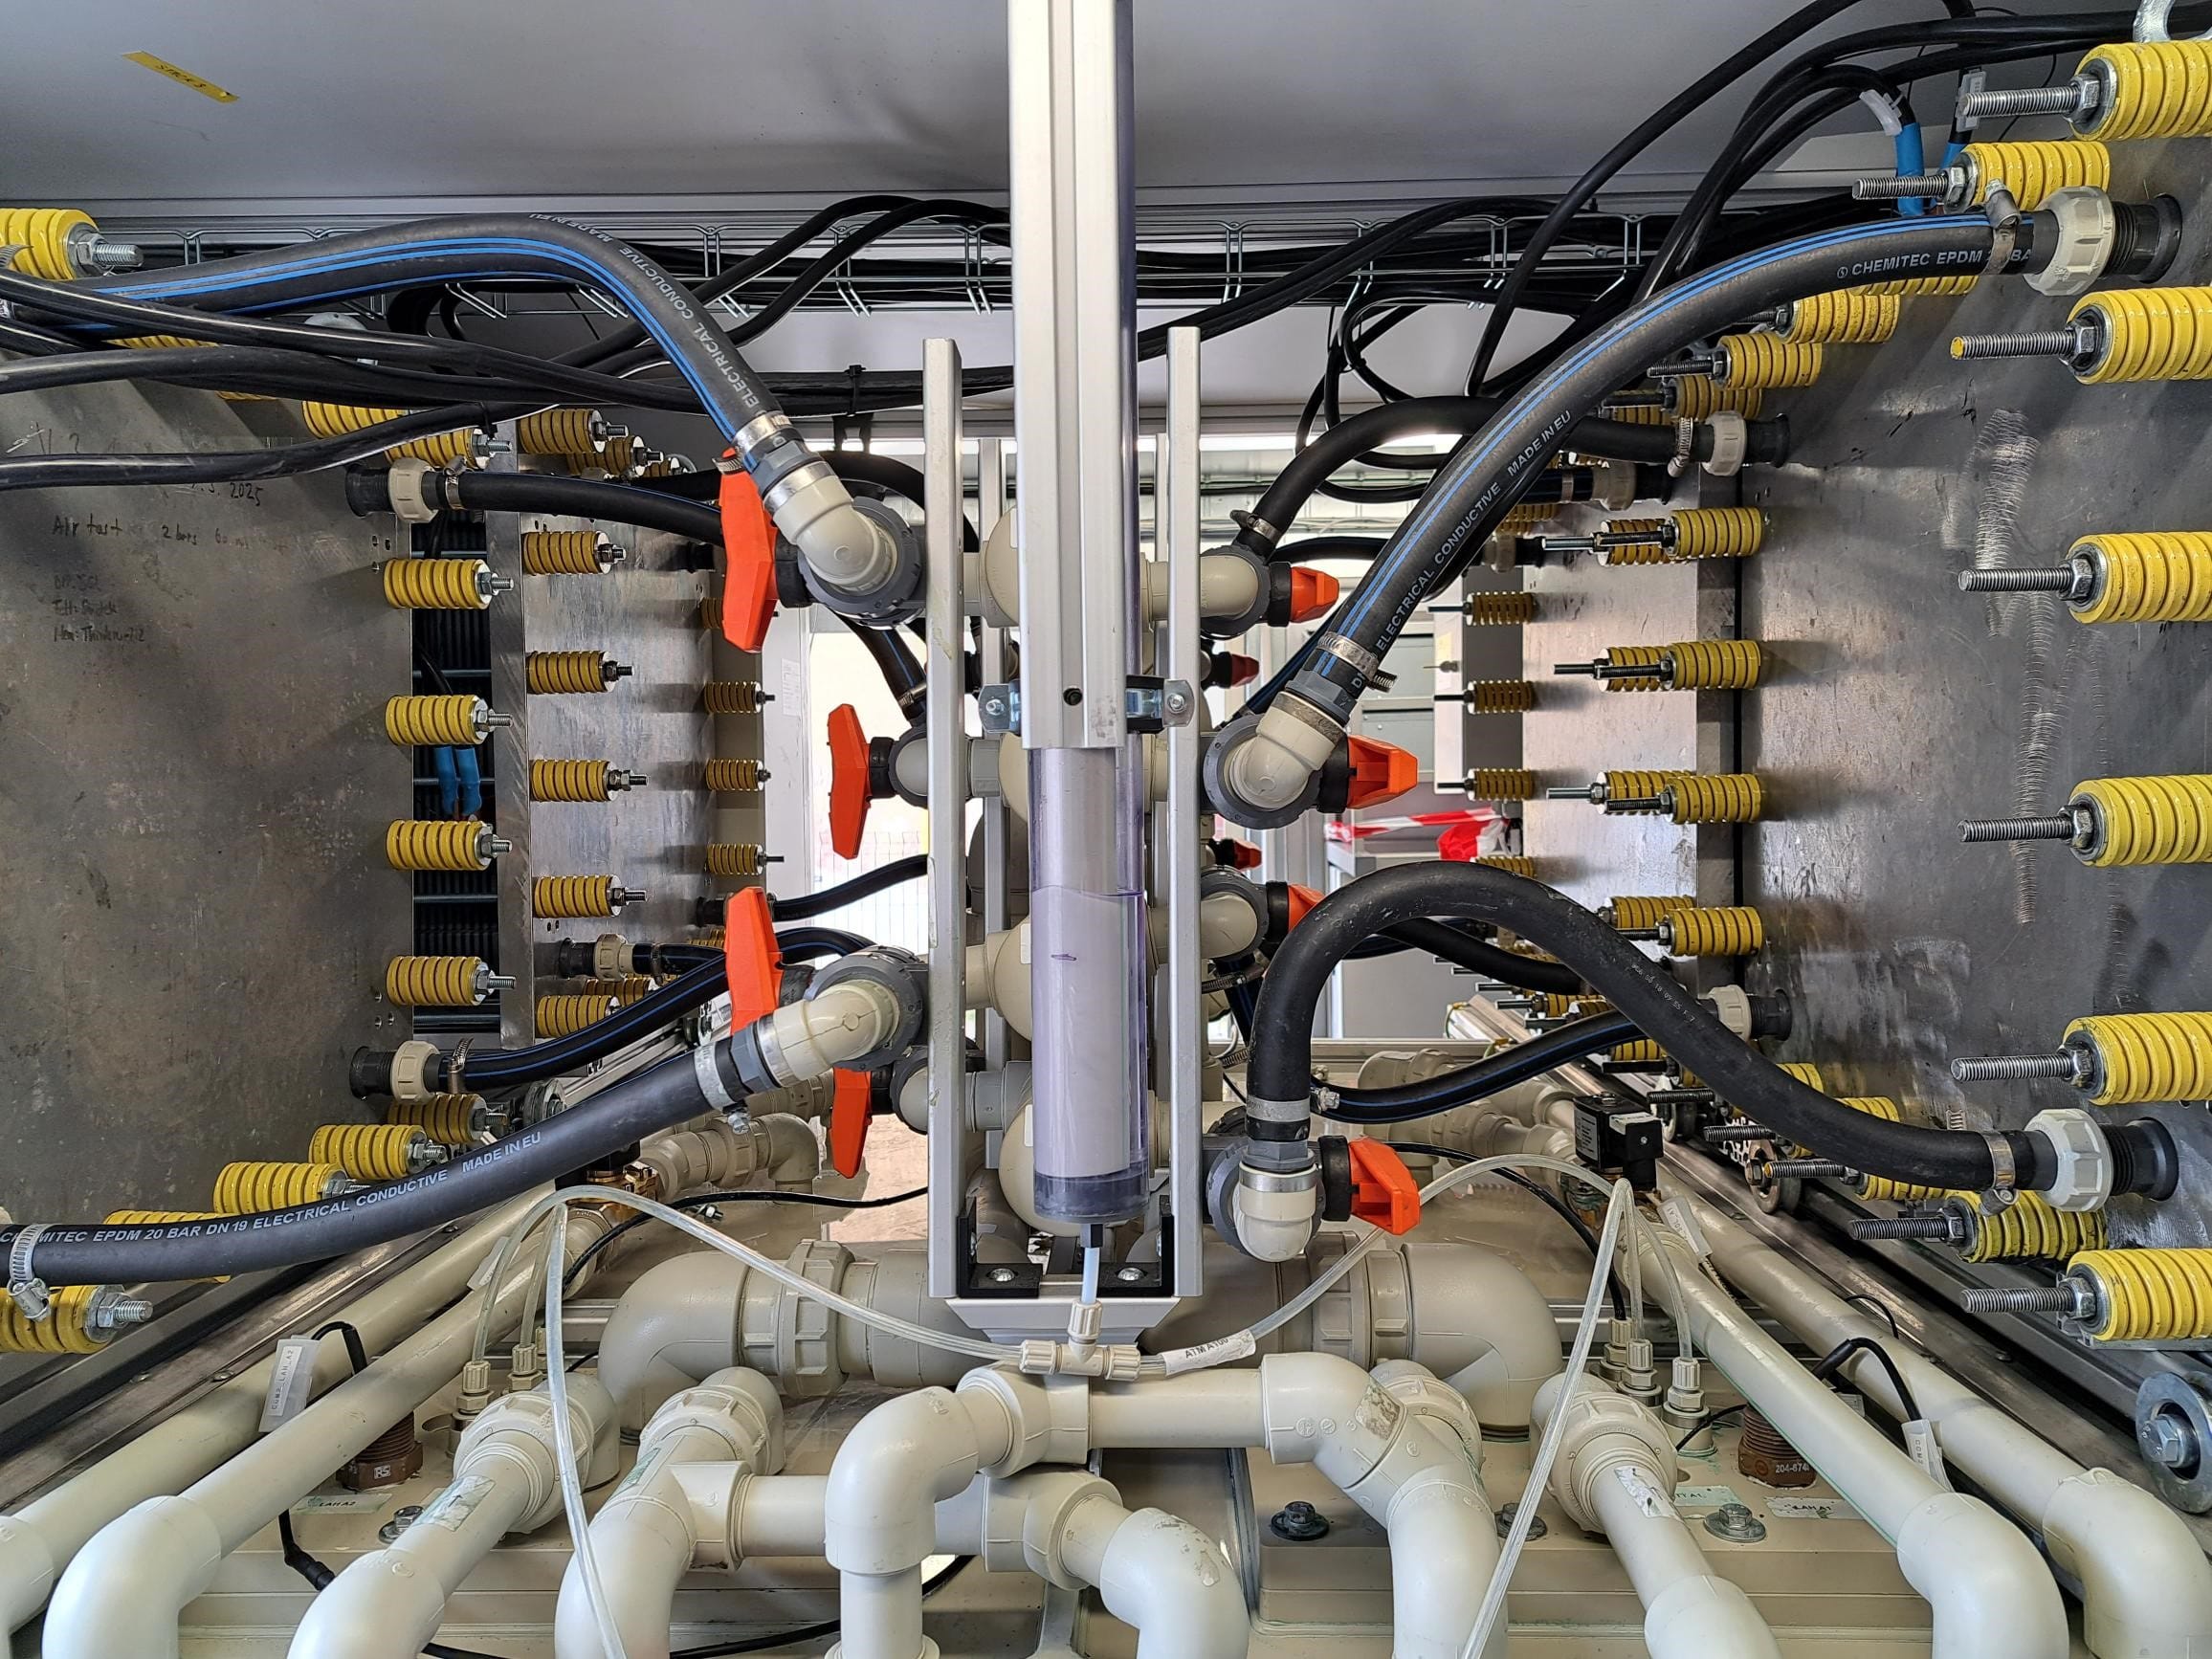
Redox flow battery energy storage system
Interior RFB BESS Configuration